PROCESS: Checking regression assumptions
How to make sure that the regression assumptions are met when using PROCESS for SPSS
Arndt Regorz, Dipl. Kfm. & M.Sc. Psychologie, 08/19/2021
This is the companion webpage to my video tutorial about regression assumptions in PROCESS. Here you can find an annotated output for an assumptions check with SPSS (Vs. 25) after rebuilding your PROCESS model there.
Content
1. Video tutorial
(Note: When you click on this video you are using a service offered by YouTube.)
2. Assumptions check with SPSS
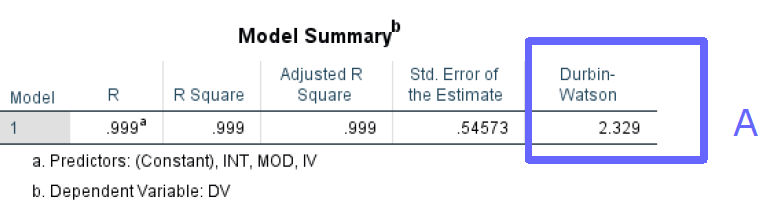
A. Uncorrelatedness of residuals
Here you find the Durbin-Watson-statistic for first degree autocorrelation. It can show values between 0 and 4. Ideally its value should be near 2. Values above 3 or below 1 are strong indicators of correlated residuals.
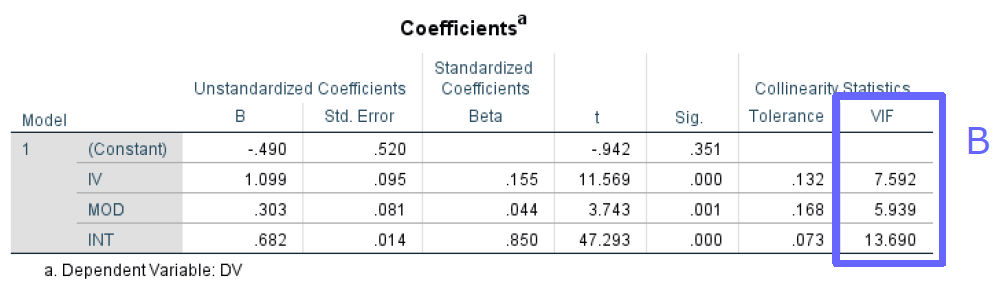
B. Abscence of strong multicollinearity
The variance inflation factors (VIF) can be used to diagnose multicollinearity. Values above 10 are indicators of strong multicollinearity.
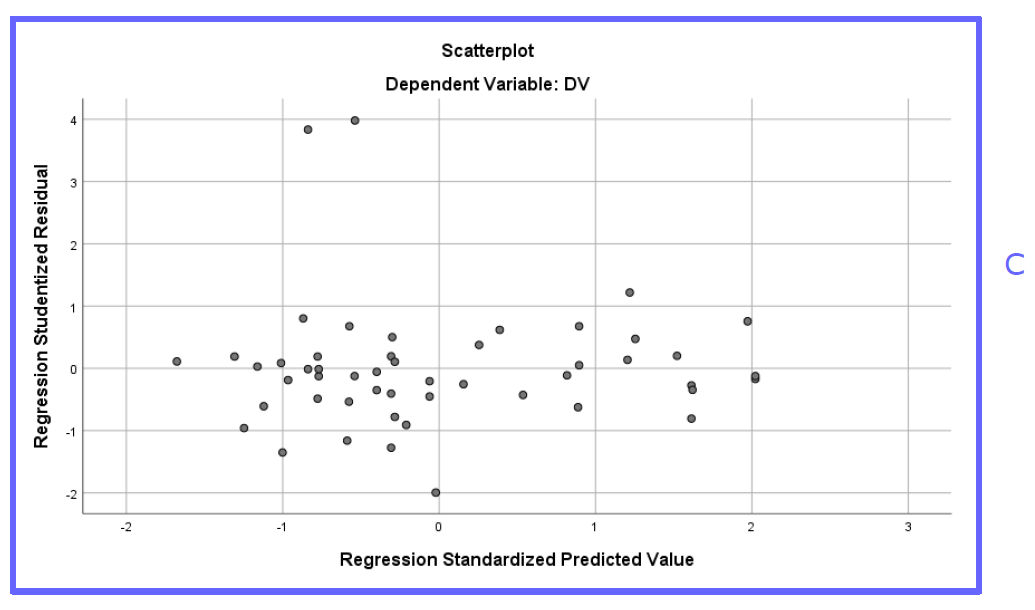
C. Homoscedasticity
This plot should show a random rectangular shape. A systematic pattern of the values would be an indicator for heteroscedasticity (e.g. if it were funnel shaped).
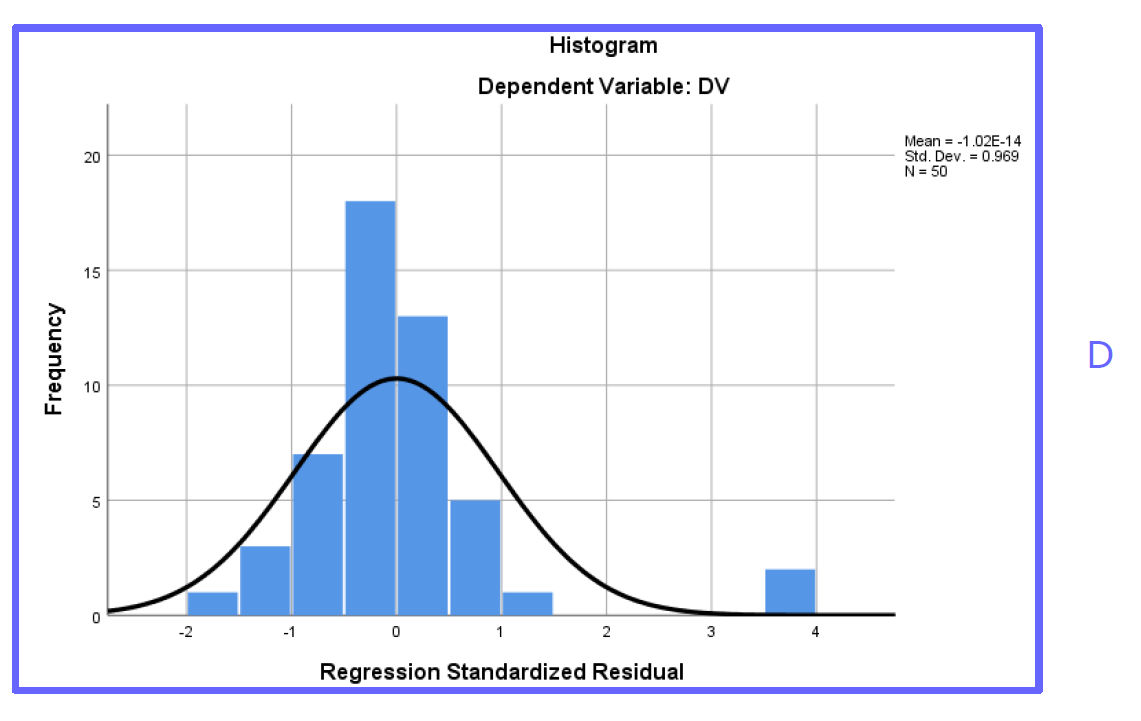
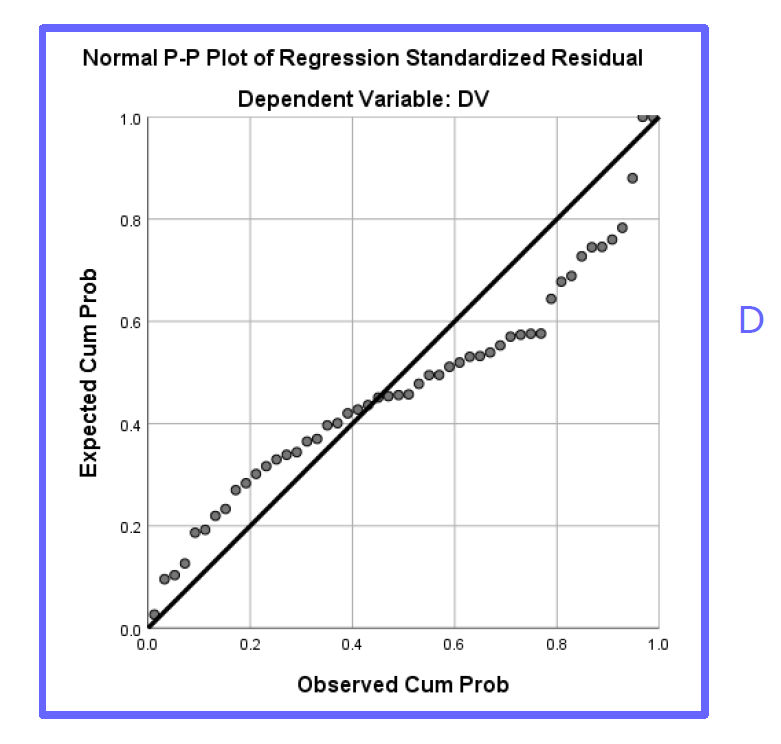
D. Normality
The histogram and the p-p-plot can be used to check for normality. The histogram should look like a normal distribution; especially important are the two tails of the distribution (no fat tails!). In the p-p-plot the points should lie near the diagonal line.
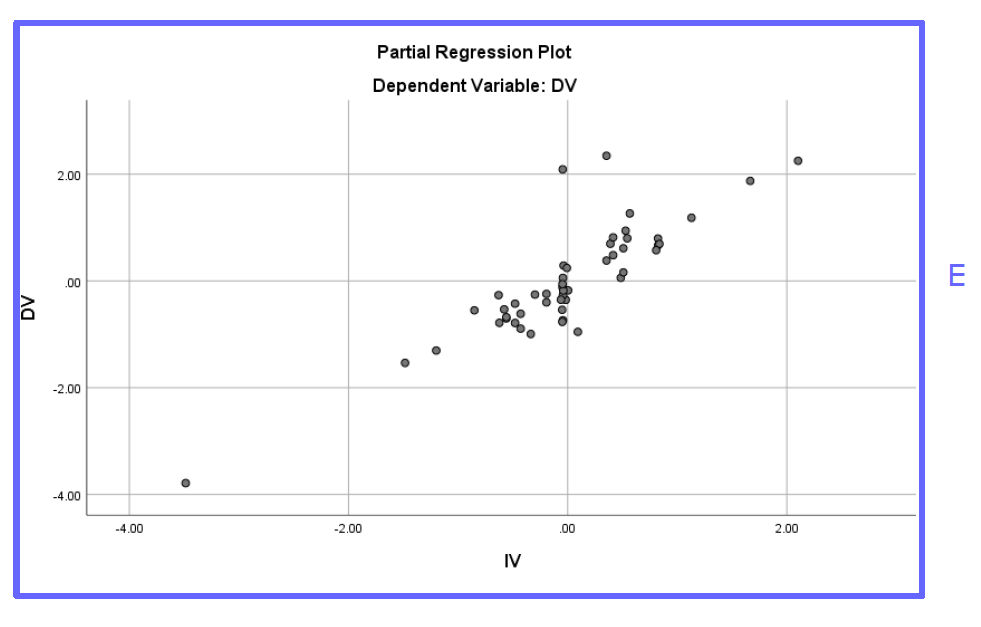
E. Linearity
The partial scatterplots should not show a nonlinear relationship (e.g. no u-shaped or inversely u-shaped curve).
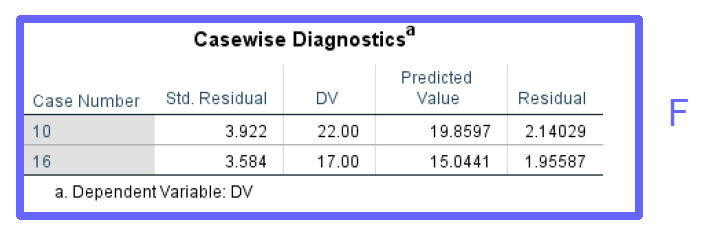
F. Outliers
This table shows extreme outliers with |residuals| > 3 SD. If this table is requested but not printed then there are no extreme outliers according to this criterion. How many of those are acceptable depends on the sample size.
G. Saved values
The saved values you requested from the save-dialog (residuals, outlier-statistics) are saved at the end of the data table. Now you can run statistical tests on them (e.g. Shapiro-Wilk) or plot them.