SEM/CFA: Checking the Linearity Assumption in R/lavaan
by Arndt Regorz, MSc.
April 21, 2024
Confirmatory factor analysis (CFA) and structural equation modeling (SEM) have assumptions and you have to check them before interpreting your results. One crucial assumption is linearity. This blog post shows you how to test that assumption and tells you what to do if the assumption is violated.
1. The Linearity Assumption
One assumption for SEM and CFA is the existence for a linear relationship between the latent variables. In the case of an SEM this applies primarily to the structural paths. In the case of a CFA this applies to the factor correlations.
But in reality, that is not always the case. There exist relationships that are non-linear, e.g., a u-shaped or an inverted u-shaped relationship. If you fit a model assuming linear relationships in a situation like this then wrong results and wrong conclusions for your hypotheses will follow!
In principle, the linearity assumption is relevant for the factor loadings, too.
2. How to Check the Linearity Assumption Between Latent Variables
In a regression analysis you check the linearity assumption by looking at bivariate scatterplots between all pairs of predictor and criterion variables. If you are using SEM software to analyze a path analysis (with manifest variables only), then you can use this approach, too.
But with SEM and CFA there is a problem: You don’t have values for your latent constructs in your dataframe, because the latent variables have to be inferred from the indicator variables during the estimation process.
The solution to that problem? Extracting factor scores.
Factor scores are estimates for the latent variables. These can be extracted from a fitted CFA or SEM. After extracting them you can use them to run scatterplots to assess linearity.
This is the process you can follow:
First, you fit a CFA including the latent constructs, regardless of whether you want to analyze a CFA or an SEM.
Then you estimate factor scores for the latent variables in your CFA.
These factor scores are then used for bivariate scatterplots to assess linearity. You need one scatterplot for each pair of variables that is connected by a structural path (e.g., in an SEM) or a covariance (e.g., in a CFA).
3. Using Factor Scores in a Lavaan Model
Let’s do that with a very simple SEM based on a dataset that is part of lavaan.
Figure 1
SEM Example
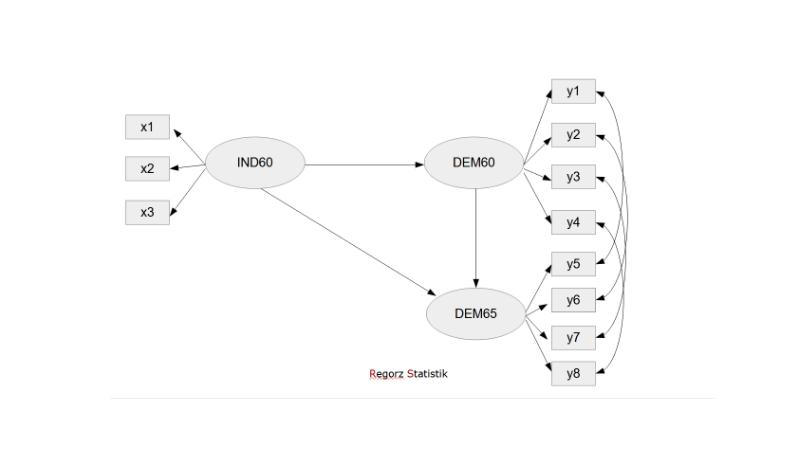
First, we build a CFA with the constructs of the model.
library(lavaan)
cfa_model <- '
# Loadings
Dem60 =~ y1 + y2 + y3 + y4
Dem65 =~ y5 + y6 + y7 + y8
Ind60 =~ x1 + x2 + x3
# Error covariances between repeated measures
y1 ~~ y5
y2 ~~ y6
y3 ~~ y7
y4 ~~ y8
'
model_fit1 <- cfa(data = PoliticalDemocracy,
model = cfa_model)
summary(model_fit1, fit.measures = TRUE)
Normally, we would check global fit (fit indices) and local fit (e.g., modification indices). In this demonstration I skip this (necessary) step and go directly to the factor score estimation.
There is a function to estimate factor scores. For that you can use different estimation methods, here I use the Bartlett method:
fs <- data.frame(lavPredict(model_fit1, method = "Bartlett"))
Let’s look at the results.
head(fs, 10)
...........Dem60 ..... Dem65 .....Ind60
[1,] -2.9176070 -1.8494572 -0.5489811
[2,] -3.6455240 -0.8472825 0.1525400
[3,] 2.9539067 3.3041743 0.7494107
[4,] 3.1654541 2.3751326 1.2903605
[5,] 2.2485088 1.8487656 0.8600035
[6,] 0.9660251 -0.8673881 0.2273830
[7,] 1.0691230 -0.3359311 0.1239967
[8,] -0.1509927 1.4254212 0.1257002
[9,] -1.7646638 -0.3616823 0.2722987
[10,] 3.4061039 3.5183944 0.3976542
Now, we can use these scores to check the linearity assumptions.
plot(fs$Ind60, fs$Dem60)
plot(fs$Ind60, fs$Dem65)
plot(fs$Dem60, fs$Dem65)
Figure 2
Linearity Tests
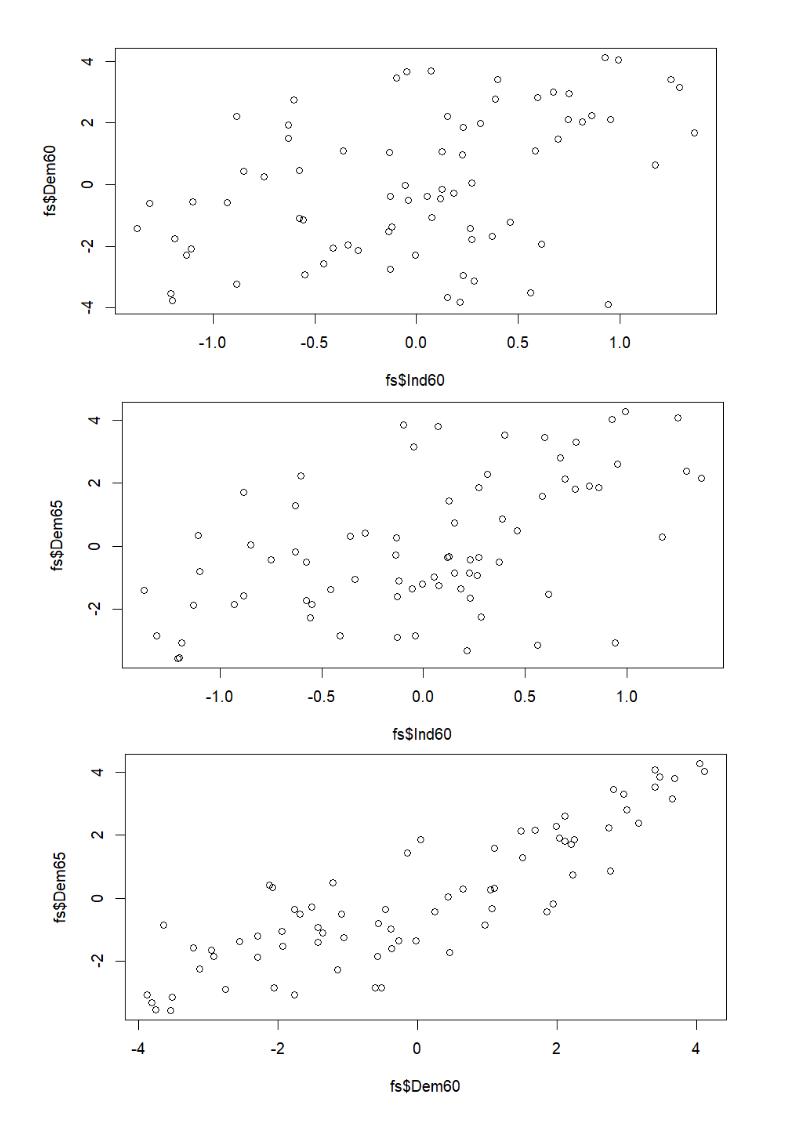
In this example there are no indications of a violation of this assumption.
4. How to Check the Linearity Assumption for Factor Loadings
In principle, the factor loadings assume a linear relationship between factor and item as well. In an SEM I normally do not bother checking this (even though in theory I should do it).
But if a CFA is used to validate a new scale then I definitely recommend checking the linearity of the loadings, too. Because an item that has a nonlinear relationship to the construct it is supposed to be measuring is problematic in a scale.
You can spot items like this in a similar way as spotting linearity violations between factors. First, you run a CFA and extract factor scores. Then you run bivariate scatterplots, but in this case between the individual items and the factor score. If you identify an item with a nonlinear relationship to its factor you should think real hard about whether you want to retain that item.
5. Checking Linearity of Loadings in Lavaan
Above, we extracted factor scores from a CFA of the measurement model. We can use these factor scores for checking the linearity of loadings, e.g. for the construct Dem60:
plot( fs$Dem60, PoliticalDemocracy$y1)
plot( fs$Dem60, PoliticalDemocracy$y2)
plot( fs$Dem60, PoliticalDemocracy$y3)
plot( fs$Dem60, PoliticalDemocracy$y4)
As an example for the first loading see Figure 3.
Figure 3
Linearity Test Loadings (first loading)
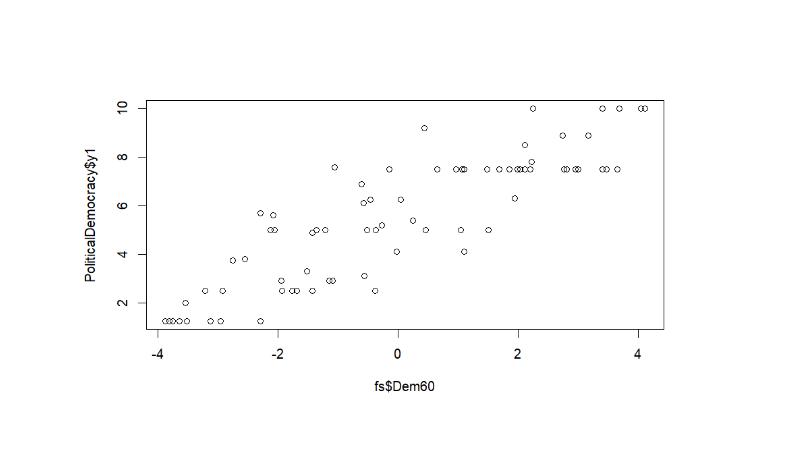
There is no indications for a violation of the linearity assumption.
6. What to Do if There is Nonlinearity?
But what can you do if the linearity assumption is not met? If a scatterplot shows a u-shaped or an inverted u-shaped relationship between the latent variables?
In that case you will have to run a nonlinear model.
Maybe you already know this from regression analysis. If the linearity assumption is violated there, then you use polynomial regression, including the squared value of a predictor in addition to (not: instead of) its normal value.
You can do the same with a CFA or an SEM. Here, the crucial challenge is how to build a measurement model for a squared latent variable.
In this YT-video I have explained how you can implement this with lavaan:
https://youtu.be/KPvrbC3DXSY
References
Muthen, B. O. (2013, October 19). Structural equation modeling: Assumptions such as linearity of relationships [Discussion post]. Mplus. https://www.statmodel.com/discussion/messages/11/16249.html?1431536904
Rosseel, Y. (2023). Package ‘lavaan’ (Version 0.6-17). CRAN. https://cran.r-project.org/web/packages/lavaan/lavaan.pdf
Citation
Regorz, A. (2024, April 21). SEM/CFA: Checking the linearity assumption in R/lavaan. Regorz Statistik. https://www.regorz-statistik.de/blog/lavaan_linearity.html